BUSINESS ANALYTICS
ADWEKO is your expert for business analytics (BA) services, because BA paves the way to efficient, data-driven and targeted decision support.
Whether with Tableau, Microsoft Power BI or advanced analytics software – ADWEKO helps you to derive targeted insights from your data. These insights from the visually processed information help you to optimize processes, reduce costs or generate sales increases. Only those who extract the relevant information from the existing volume of data, quality-assure it and make it visually usable for themselves will be able to profit from competitive advantages in the long term.
Our best practice experience in implementation projects has shown that there are basically three overriding critical success factors:
ORGANIZATION
INTERDISCIPLINARITY
PROCEDURE MODEL
ORGANIZATION
INTERDISCIPLINARITY
PROCEDURE MODEL
ADWEKO’S SERVICE OFFER
ADWEKO accompanies you on the way to a business analytics strategy – from the selection of the appropriate BI tool to the maturity assessment of the current BI architecture to the implementation of a Business Analytics Competence Center (BACC). In the process, dashboards are established that can be used transparently at all hierarchical levels in your company – from the board of directors to the clerks.
- SELF-SERVICE BUSINESS INTELLIGENCE
- BUSINESS ANALYTICS STRATEGY
- OPERATIONAL REPORTING & DASHBOARDS
- ADVANCED ANALYTICS
Together with us, Self-Service Business Intelligence (SSBI) enables your employees to create reports or analyses themselves, without the fundamental need for collaboration with the IT department. To enable self-service, ADWEKO offers methods and tools tailored to their needs. By accessing data sources through intuitive tools, business departments are empowered to access, understand, prepare, and analyze data. We also address the different levels of self-service. Here, different applications or methods can help to manage topics such as data culture, data literacy, data catolog/business glossary, metadata management or data governance.
Basically, strategies are necessary above all to sustainably anchor guard rails and processes in the company. Based on typical challenges encountered in practice, an appropriately accentuated business analytics strategy can help solve them, align with business goals, and help achieve them. These challenges can be subsumed under the following three overarching themes and symptoms:
System diversity and need for consolidation
-
- Unclear and poor data quality
- Unclear data origin
- Undefined analytical processes
Tactical approach
-
- Orientation to day-to-day business
- Alignment with the department
- Orientation to IT strategy
Organizational challenges
-
- Unclear or lack of organization for BA projects and applications.
- Acceptance problems
- Unclear responsibility
We support you in the development of operative business intelligence reporting via dashboards up to “data story telling”. A process model, which can be divided into five phases, has proven its worth. After an interdisciplinary collection or conception of initial use cases including functional/non-functional requirements, these are prioritized and rolled out within the framework of agile project concepts. We then develop a technical solution concept – from the identification of all necessary data sources, the creation of a data model, the detailed conception of ETL routes to aggregations or precalculations in (virtualized) reporting layers. We then implement the data integration concept and design the planned dashboard for you. Here, we pay particular attention to visually appealing designs and follow standards such as the IBCS. Finally, all components are tested, optimized, documented and approved.
Agile methods have proven to be best practice approaches. Nowadays, it is more important than ever to be able to adapt quickly to changing conditions and to be able to act. Important application areas are thus quickly productive, creating additional room for maneuver for optimizations.
Complementing the use cases, an accompanying concept ensures automation, systematics and collaboration. This includes, for example, a concrete definition of the data sources and the data model, the key figures and dimensions as well as the logics or the information design. Genuine value creation from data can only succeed if working with data becomes a natural part of daily work processes. One example is automated alerts, which proactively inform about changes in relevant company key figures. These help to provide important insights and thus to be able to react to events in a timely manner.
Using Advanced Analytics (AA), we offer a collection of different tools to predict future events based on structured or unstructured data. In general, AA goes beyond traditional business intelligence approaches and focuses on using predictive models, statistical methods, machine learning and artificial intelligence to analyze data.
A BA strategy offers the best prerequisites for the implementation of a BACC and related measures such as the creation of an operations manual for an efficient organizational structure and process organization.
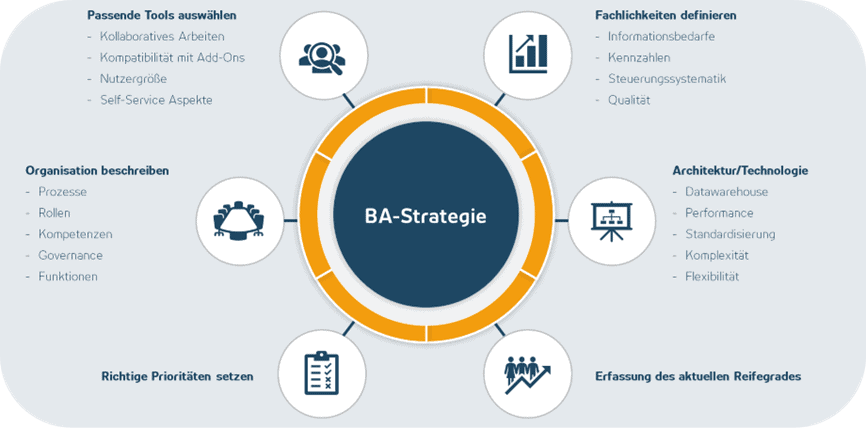
ANALYSIS OF THE EXPERTISE
Within this process step, the company is first viewed from a business perspective. The processes and methods used are examined in terms of their potential impact on the BI application landscape. These include the dimensions to be reported, the type of planning and projection, calculation or risk calculation, which are recorded and systematized at different aggregation levels. This is accompanied by the identification of the decision-making objects, such as customers, products, stores or internal organization. This is usually a multidimensional business management model, as is characteristic of the design of business intelligence/analytics systems. Procedures, methods and also decision objects are finally classified with regard to their effect in the decision process. The result should be a structured high-level overview of corporate management tools and methods. Based on this, the content focus and contact persons for the information analysis can be determined. Information requirements and supply in the process organization are systematically surveyed to determine a degree of coverage. In this respect, it is also determined which information is necessary to support the decision-making processes and, if necessary, prioritized.
ARCHITECTURE/ TECHNOLOGY
The analysis of the existing architecture and technology should be done systematically according to the typical characteristics of BA systems. Example dimensions would be data sources and volumes, timeliness of loading cycles, data distribution and logistics, geographic spread, costs and benefits, systems and processes, number and type of users, functionality and complexity, business processes, integration levels, or business concepts. Applications that are already planned or in the process of being implemented can also be documented in this way. This provides comparability and allows similar applications to be identified and potential synergies to be identified.
MATURITY MODELS & DETERMINATION
The structured assessment of the maturity of products in terms of their impact on the market and in comparison with competitors is regularly carried out in companies with reference to the product life cycle assessment in strategic marketing. Another form is the assessment of the maturity of organizational-technological topics in the company such as business analytics or business intelligence. Within the framework of a Business Analytics Maturity Model, important perspectives of maturity such as content consolidation, organization/responsibility or even profitability are considered. In this way, potential for further development can be identified and strategically evaluated.
TOOL SELECTION
The determination of the BA target software portfolio as a partial result of a BI strategy differs from the classic software selection for new product introduction in that the number of tools used is usually to be reduced. Therefore, the focus here is more on optimizing the tools already in use. The first step is to identify all existing tools and document their use in detail. For a valid strategic basis for decision-making, aspects such as the number of users, license fees or even the functionalities are taken into account. Another essential basis for determining the target software portfolio is the IT strategy. It ensures the integration of BI software into the existing IT architecture and also highlights two fundamentally different approaches – “best of breed vs. BI suite”.
ORGANIZATION
Many challenges in the practical application of BA can be traced back to inconsistencies in the organizational structure and process organization. In this respect, the overarching cooperation of the specialist departments and the interaction of specialist departments with IT must be analyzed more closely. The analysis of the organization should extend into the study of selected business processes. Purely technical processes should also be illuminated. One process that is subject to frequent adjustments is the planning process, for example. Is it ensured that every change is sufficiently communicated to all stakeholders and mapped in the system? Do planners respond quickly enough to procedural adjustments? Are decisions sufficiently documented so that it is comprehensible for a knowledgeable third party? Various tools are available for documenting the organizational structure and process organization, such as an organizational chart or the modeling of event-driven process chains.
BI-TOOL FOCUS
Power BI
- Self-service analytics in the enterprise: MS Power BI reduces security risks, complexity, and additional costs and can be used by both individuals and organizations.
- Faster Big Data preparation with Azure: If you want to simplify the analysis and sharing of big data, Azure is the ideal tool for you. With an unlimited Azure Data Lake, you can get insights faster and enable more efficient collaboration between business analysts, data engineers, and data scientists.
- Intelligent tools for reliable results: A variety of data visualizations, built-in AI capabilities, Excel integrations, and pre-built and custom connectors allow you to gain and share critical insights.
- Microsoft Add-Ons: Combine your reports with proven Microsoft tools like Power Automate to automatically notify key stakeholders of data-related boundary breaches in a timely manner.
- Protected content: Restrict content in reports and apps to selected audiences or user groups with complex hierarchy models.
Tableau
- Customized visualization and analysis options: Take advantage of the diverse range of visualization options. Make your reports and analyses look unique and distinctive.
- Compatible and performant in the cloud or on-premise: Need to meet regulatory or corporate requirements or want to leverage scalability in the cloud? Then Tableau offers a compatible and performant solution with Tableau Server and Tableau Cloud that fits your business.
- Data governance: Row-level security restricts the visibility of dashboard content to individual users or groups of users.
- Data Lineage & Data Catalog: Understand your dashboards and trace the provenance of your data back to the metadata level in the source.
SAP Analytics Cloud
- Centralized Intelligence: Track your metrics in real time on our interactive dashboards.
- Analytics in the intelligence era: The Business Intelligence & Augmented Analytics capabilities of SAP Analytics Cloud help you to evaluate and predict business results. Reduce uncertainty with the help of a simple cloud solution.
- Integrated Planning: Create your business planning seamlessly with an all-in-one business intelligence & planning software solution that pays for itself. No more isolated solutions. Say goodbye to endless reconciliation and manual copying and design your business planning with a powerful end-to-end solution.
- Interactive results: SAC allows you to analyze data with the finest granularity. You can also run simulations directly from the Digital Boardroom with a 360° view of your company. Your insights become more relevant, accurate and actionable with Augmented Analytics & Machine Learning.
BUSINESS ANALYTICS USE CASES
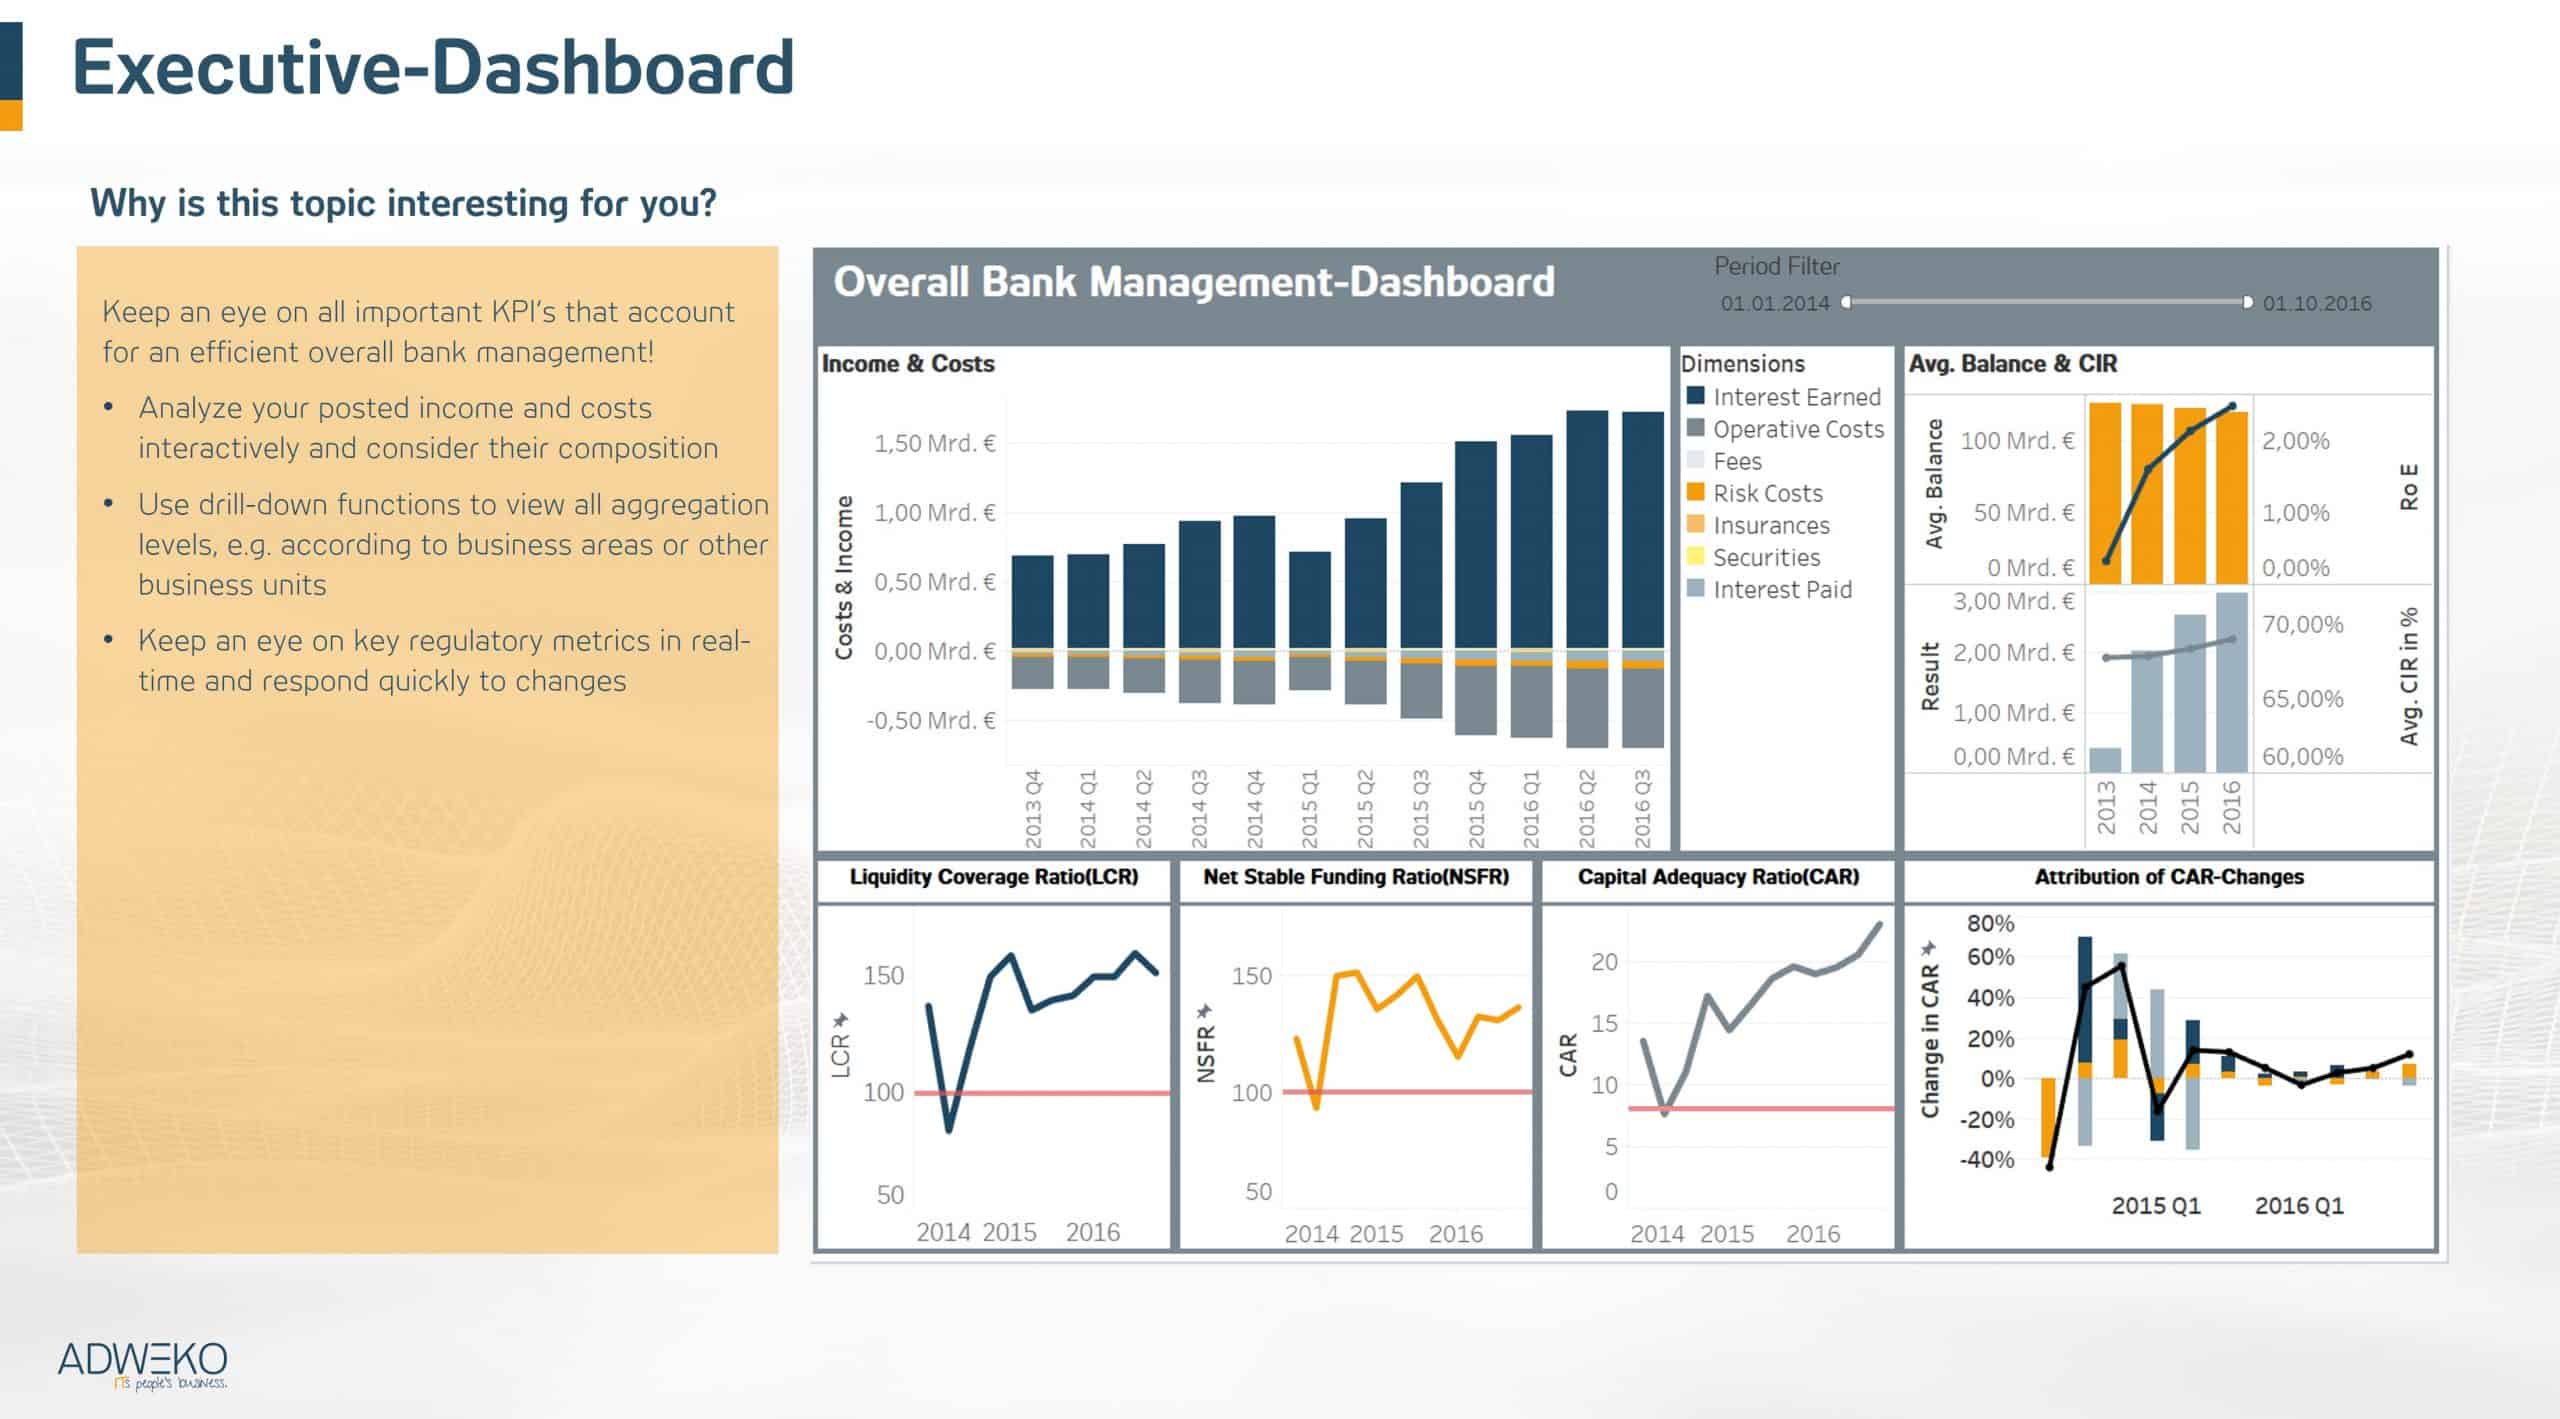
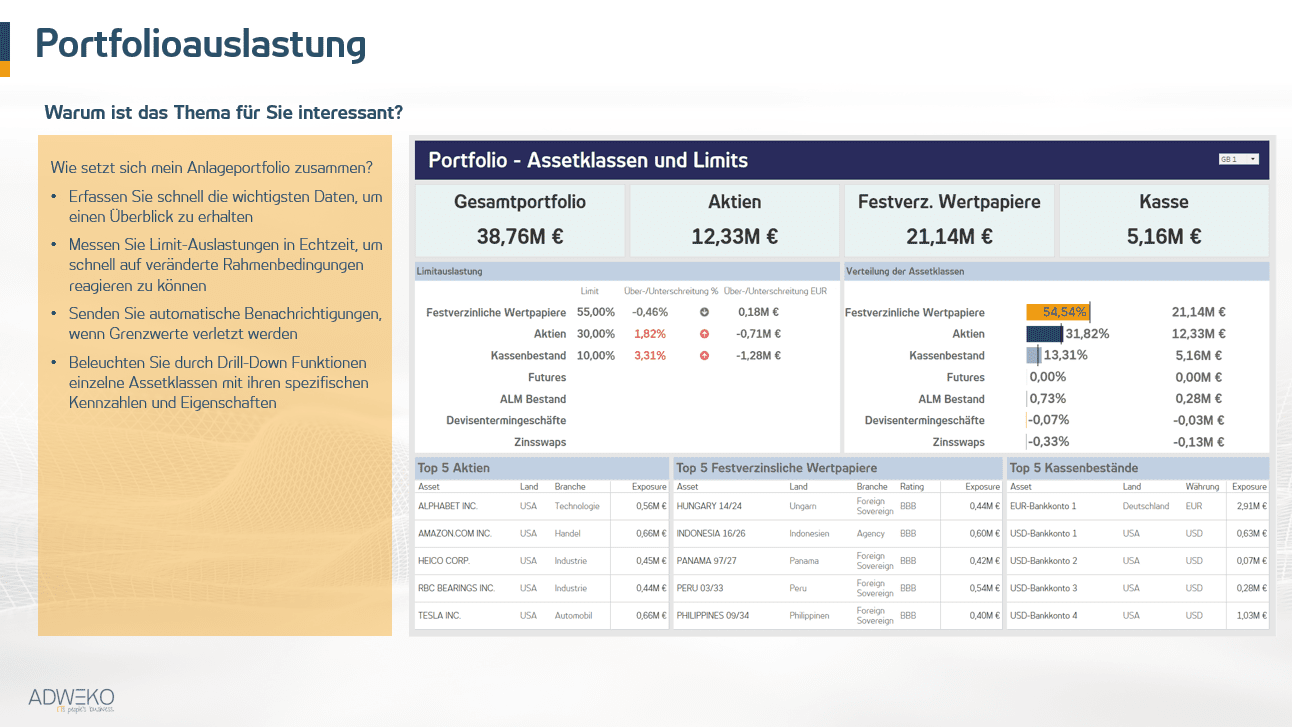
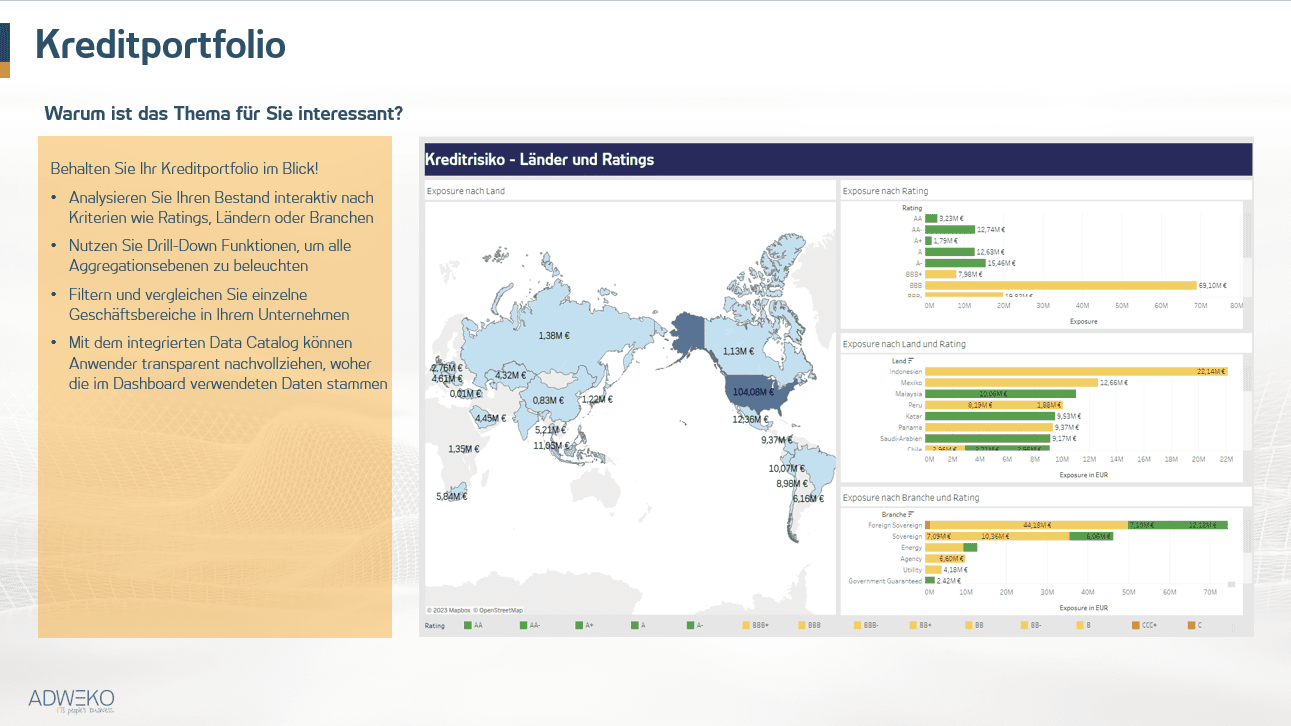
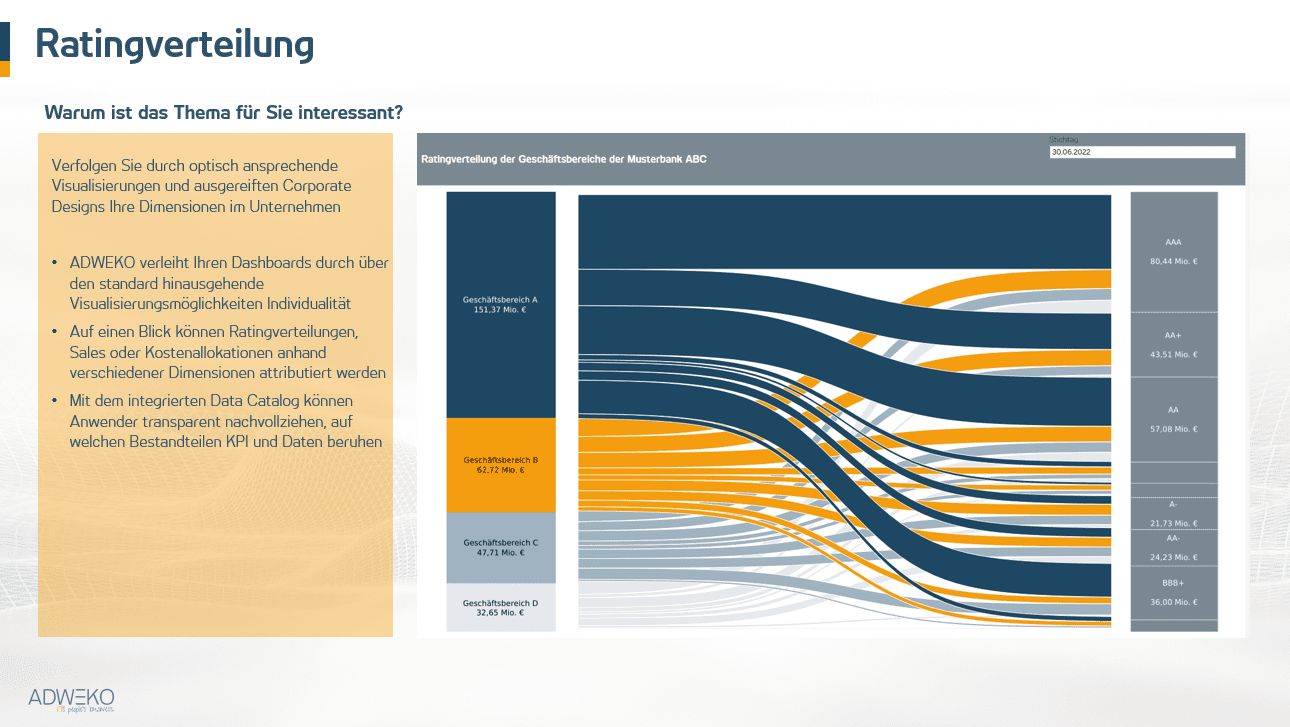
Business analytics offers many different use cases. Common use cases include creating a board dashboard that meets requirements, mapping portfolio utilization and the loan portfolio, and visualizing rating distributions:
A comprehensive range of training courses rounds off our services, so that nothing stands in your way of using self-service BI.


